Latest Blog:

AI Powered Dashboard are Live

Transit 360 Analytics Suite delivers clarity in motion

Unify your transit data across safety, fleet, and operations. Transit 360 delivers live, strategic insights for executives replacing fragmented reporting with clarity, foresight, and system-wide visibility.

System-Wide Visibility

84% of transit leaders say fragmented data delays decision-making.

Transit 360 unifies operations, safety, and fleet data delivering one clear view for executives.

Faster Response

Agencies using real-time analytics report up to 40% faster service interventions.

Transit 360 empowers leadership to detect disruptions and act before riders feel the impact.

Operational Alignment at Scale

Disjointed systems lead to miscommunication and inefficiency.

Transit 360 keeps planning, ops, and safety teams aligned with shared, role-based insights.

Planning That Keeps Pace

Agencies cut planning cycles by 50% with predictive dashboards.

Transit 360 helps leaders plan routes, staffing, and maintenance with confidence and agility.

Trusted by Leading Institutions

What is Transit 360 Analytics Suite?

Transit 360 Analytics Suite is a unified, cloud-based analytics solution purpose-built for transit agencies. It brings together real-time data from buses, trains, microtransit, and field operations to give transportation executives a complete, connected view of their transit system.

With Transit 360, leaders gain instant access to live metrics across safety, service reliability, fleet performance, and route optimization all in one intelligent dashboard. It eliminates data silos, shortens reporting cycles, and empowers agencies to improve decision-making, reduce operational risk, and deliver consistent, rider-first service across the network. 

Key Capabilities That Power Smarter Transit

Transit Operations Analytics

Deliver system-wide insight into service performance, safety, and fleet readiness—designed for leadership clarity.

Real-Time Performance Monitoring

Track ridership, service availability, and on-time metrics across all modes in a unified dashboard.

Safety and Risk Intelligence

Analyze collisions, incident trends, and operator behavior to inform proactive safety planning.

Fleet and Maintenance Visibility

Monitor vehicle health, fuel use, and maintenance cycles to reduce downtime and improve asset efficiency.

Safety and Incident Analytics

Empower agencies to move from reactive reporting to proactive risk prevention through connected safety intelligence.

Collision and Incident Trends

Identify patterns in preventable vs. non-preventable incidents across routes, modes, and operator profiles.

Risk-Based Operator Insights

Monitor behavior trends by operator to target training, reduce exposure, and improve accountability.

Emergency Response Metrics

Track response times and service impacts to continuously refine protocols and improve readiness.

Route and Service Optimization

Use data-driven insight to align transit schedules, capacity, and routing with actual demand and rider behavior.

Trip Performance Analysis

Assess route-level punctuality, missed trips, and delay causes to fine-tune schedules and fleet deployment.

Demand-Based Scheduling

Match service levels to rider flow by time of day, corridor, or mode for higher efficiency.

Dynamic Network Planning

Support long-range route decisions with historical trends, real-time usage, and scenario modeling.

Strategic Goal & KPI Tracking

Track progress against key performance indicators with dashboards designed for executive oversight and public accountability.

Goal Progress Visualization

Display real-time completion rates against strategic targets set by leadership or the board.

Custom KPI Frameworks

Configure metrics across safety, service, finance, and equity—tailored to agency priorities.

Transparency & Reporting Readiness

Enable data storytelling for stakeholders, including the public, with always-on visibility.

Geospatial and Interactive Visualizations

Visualize your entire transit ecosystem on a live map connecting routes, assets, incidents, and performance in real time.

Network-Wide Incident Mapping

See exactly where delays, collisions, or service disruptions are occurring—down to the stop or corridor.

Asset and Route Overlay

Track vehicle locations, stops, and infrastructure with layered insights to support smarter planning and field response.

Drill-Down Interactivity

Click into districts, routes, or time periods to explore root causes, trends, and KPIs—directly from the map.

Why Universities Choose Higher ED360

Enterprise-Level Visibility

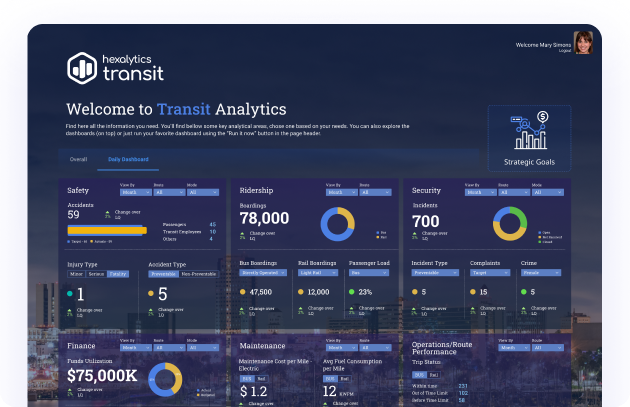
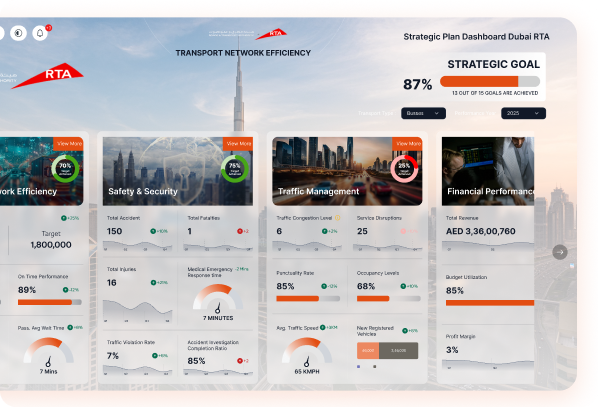
A consolidated view of system performance, risk, and investment impact across the agency.

Stronger Oversight and Accountability

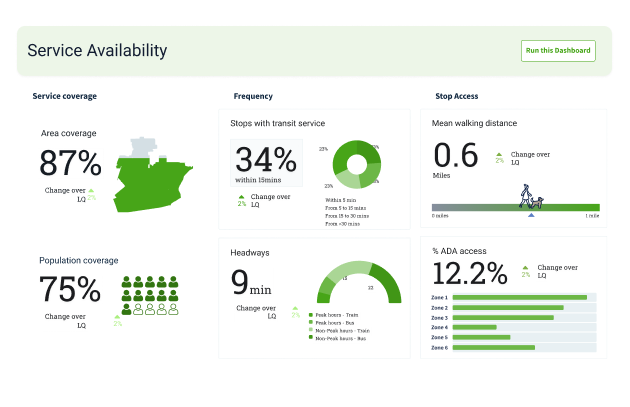
Consistent KPIs and performance signals aligned to strategic goals and public commitments.

Risk and Resilience Insight

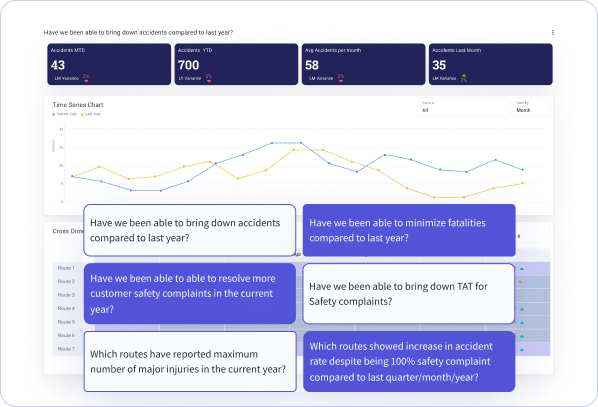
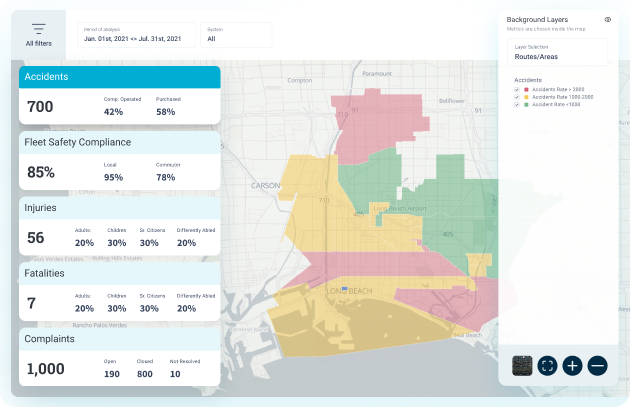
Early visibility into safety trends, service reliability, and operational stress points.

Informed Capital and Policy Decisions

Data-backed insights to support funding prioritization and long-term planning.

Transparency and Public Trust

Clear, defensible reporting that supports governance and stakeholder confidence.

Insights & Updates

Explore how AI-powered K-12 data analytics help districts improve enrollment forecasting, protect budgets, and make confident staffing and planning decisions with real-time, decision-ready data.

Frequently Asked Questions

You have questions? We have answers

Transit 360 supports multiple roles: 

  • Boards and governing authorities 
  • CEOs and executive leadership 
  • Operations, safety, and planning teams 
    Each role receives tailored, KPI-driven dashboards. 

Transit 360 follows Hexalytics’ belief that analytics should serve leadership first. The platform focuses on clarity, decision readiness, and outcomes rather than dashboards for their own sake. 

Hexalytics embeds AI where it adds value, such as early signal detection, trend analysis, and predictive indicators, while keeping insights transparent and explainable for public-sector leadership. 

Transit 360 creates a shared source of truth across operations, maintenance, safety, and planning. This reduces conflicting reports and aligns teams around common metrics. 

Most tools visualize data. Transit 360 organizes data around how transit agencies actually operate, using a domain-specific data model and leadership-driven KPIs developed by Hexalytics. 

See the Transit 360 Analytics Suite in Action

Turn fragmented transit data into operational and strategic intelligence.

In your personalized demo, you’ll see how to:

Experience clarity. Experience alignment. Experience smarter transit leadership.

Request a Demo: See Impact in Action