The Graduate Proceed to Succeed (GPS) Dashboard offers that view. It gives state education agencies a unified and AI powered way to understand how students move from early learning to long term success. It brings together the indicators that matter and turns them into clear, actionable insight. As a GPS dashboard for college and career readiness tracking, it supports a holistic readiness model designed for modern statewide needs.
Current systems often fall short because they highlight only test scores or graduation rates. The GPS Dashboard fills that gap by helping states:
Readiness is shaped by far more than academics. It reflects well-being, opportunity, leadership experiences, financial stability, and exposure to real workforce pathways. Traditional dashboards rarely bring these pieces together. What states need is a statewide academic and well-being readiness dashboard that connects the full student experience.
The GPS Dashboard changes this model. It organizes readiness into four foundational pillars that give leaders a clearer sense of strengths, gaps, and trends across the state. This helps states understand where learners are thriving and where targeted support is needed.
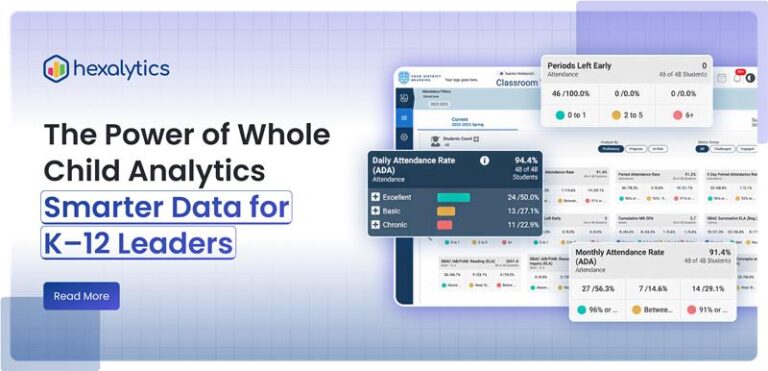
Students need strong literacy, numeracy, problem solving, and consistent attendance to advance with confidence. The dashboard brings together key indicators such as enrollment and dropout patterns, absenteeism and attendance, assessment performance, and graduation outcomes. With this unified view, SEAs gain a K12 readiness indicators dashboard for state agencies that identifies academic risks early.
2. Lifelong Well Being : Understanding Conditions That Influence Learning
Academic progress is closely tied to daily conditions. The dashboard monitors discipline patterns, economic stability, food security, and access to health insurance, giving states a deeper view of how external factors shape learning. This strengthens the support systems available to students and families.
Civic readiness prepares students to participate, lead, and contribute to their communities. The dashboard tracks involvement in leadership programs, service opportunities, and pre-apprenticeships, showing whether students are developing the mindset and skills for active citizenship.
This pillar links learning with long-term opportunity. The dashboard tracks college and career readiness indicators such as AP, IB, dual enrollment, access to financial aid, persistence, and employment metrics like time to award and wages earned. This gives states a direct view of how prepared students are for the demands of the job market.
The GPS Dashboard goes far beyond displaying isolated data points. It provides statewide visibility that helps leaders shift from reactive reporting to real time understanding. It brings together a clear statewide overview, detailed insights across each focus area, trend analysis, benchmarking across regions, and AI supported outcomes that highlight emerging risks and opportunities.
This is exactly what states need as they adopt an early warning readiness system for state education departments to identify gaps before they widen.
This level of visibility strengthens transparency, supports informed communication, and gives agencies a confident foundation for strategic decision making.
The GPS Dashboard takes readiness analysis beyond static charts and manual reporting. Its AI driven Q&A capability allows state leaders to explore data through simple, natural language questions. Leaders can ask focused queries such as:
The dashboard responds with clear, data-grounded insights in real time. There is no need to sort through spreadsheets or navigate complex reports. The ability to access answers conversationally reduces time spent on analysis and helps leaders act sooner. It supports faster decisions, stronger resource alignment, and a more responsive approach to statewide planning.
Successful transitions from classroom to career do not happen by chance. They happen when systems have visibility and structure to support every student’s path.
The GPS Dashboard gives state agencies the insight needed to shape policy, direct resources, and strengthen readiness from K-12 through workforce entry. By unifying academic, well-being, civic, and workforce indicators, it provides a complete picture that guides smarter statewide decisions.
The GPS Dashboard is built by Hexalytics and designed for statewide scale, public transparency, and leadership ready insights. It helps states track what truly matters and ensures that readiness is more than a score. It becomes a shared commitment to student success from the classroom to the workforce.
If you want a modern readiness model that reflects the full student experience, the GPS Dashboard is built for the future of state education leadership.
Request a GPS Dashboard Walkthrough to Explore Statewide Readiness Insights