Latest Blog:

AI Powered Dashboard are Live

Enrollment Dashboard for School District

Transform K-12 and P-20 enrollment data into actionable district intelligence with forecasting, analytics, demand patterns, and utilization of insights.

Trusted by Leading Districts

Watch the Enrollment Dashboard in Action

See how real time enrollment analytics support staffing, budgeting, program planning, and space utilization across every school.

Feature Highlights

Real-Time Enrollment Tracking Across Every School

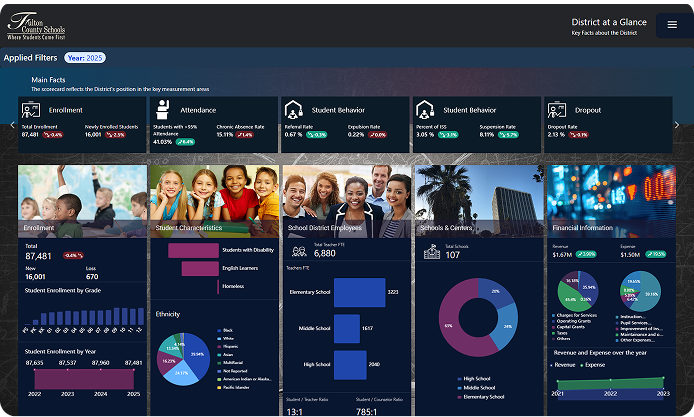
Monitor enrollment by building, grade level, program, neighborhood, and subgroup. See student mobility, transfers, withdrawals, and mid-year entry trends as they occur.

Program Demand, Yield, and School Choice Insights

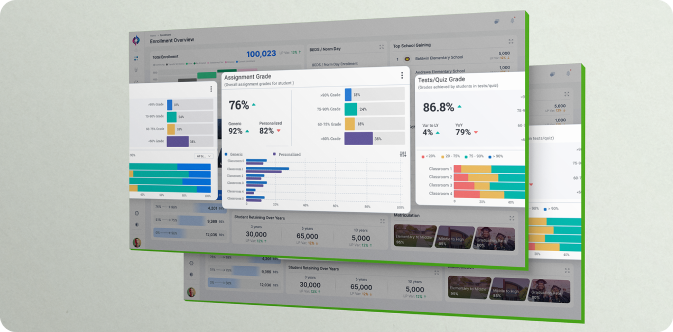
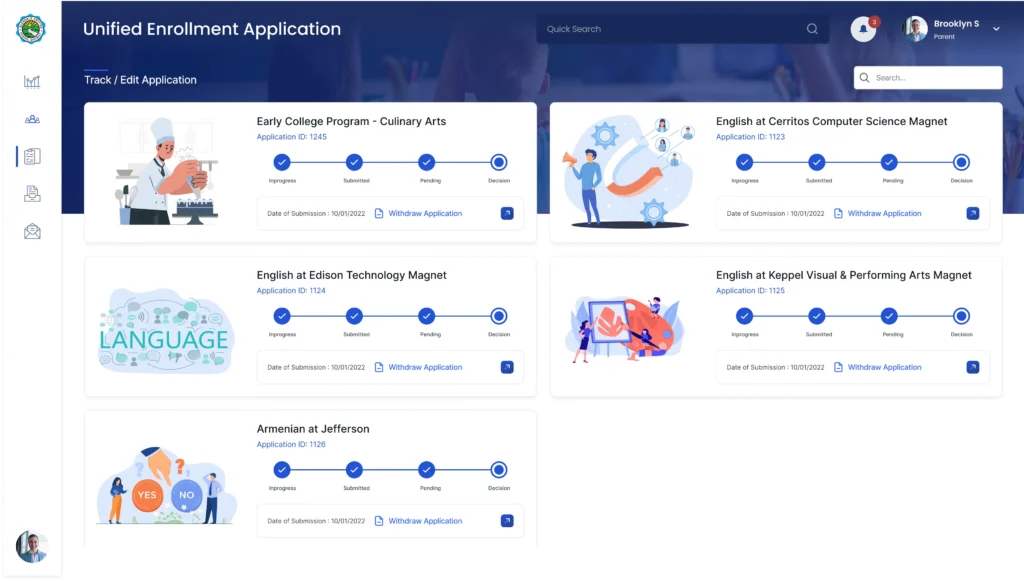
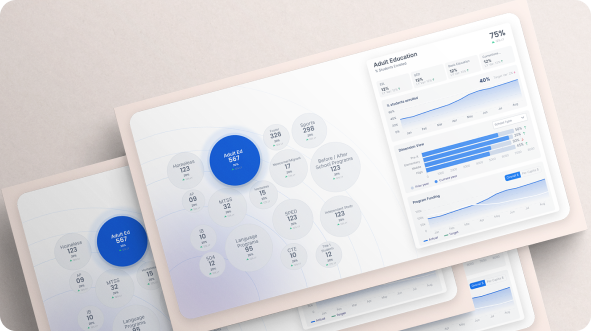
Analyze which programs attract families, which are oversubscribed, and where interest is growing. Connect CRM data for inquiries, applications, and yield analytics.

Enrollment Forecasting & Projection Models

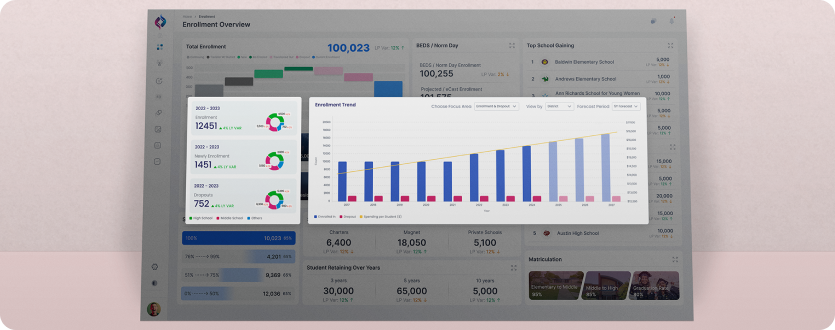
Use AI-powered forecasting to identify future enrollment changes, demographic shifts, and grade-level patterns. Plan staffing and budgeting with predictive accuracy.

Staffing, Budget, and Class Size Alignment

Link enrollment trends to HR and finance data to align staffing levels, class loads, and funding models with real enrollment needs.

Facilities, Capacity, and Boundary Planning

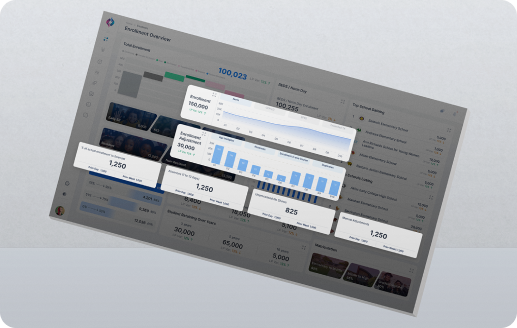
View building capacity, utilization, feeder patterns, and neighborhood movement. Support long-term facility decisions and boundary review analysis with clear data.

Integrated SIS, CRM, HR, Finance & Operations Data

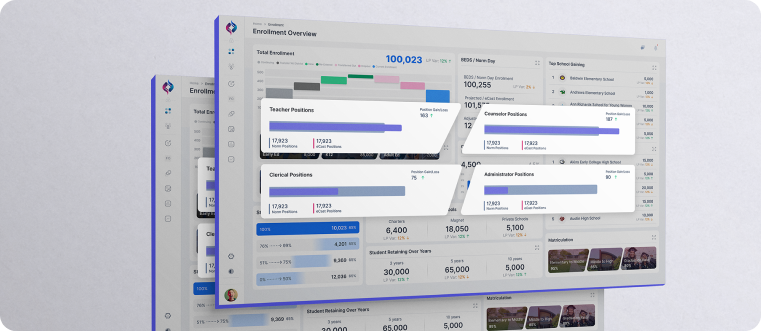
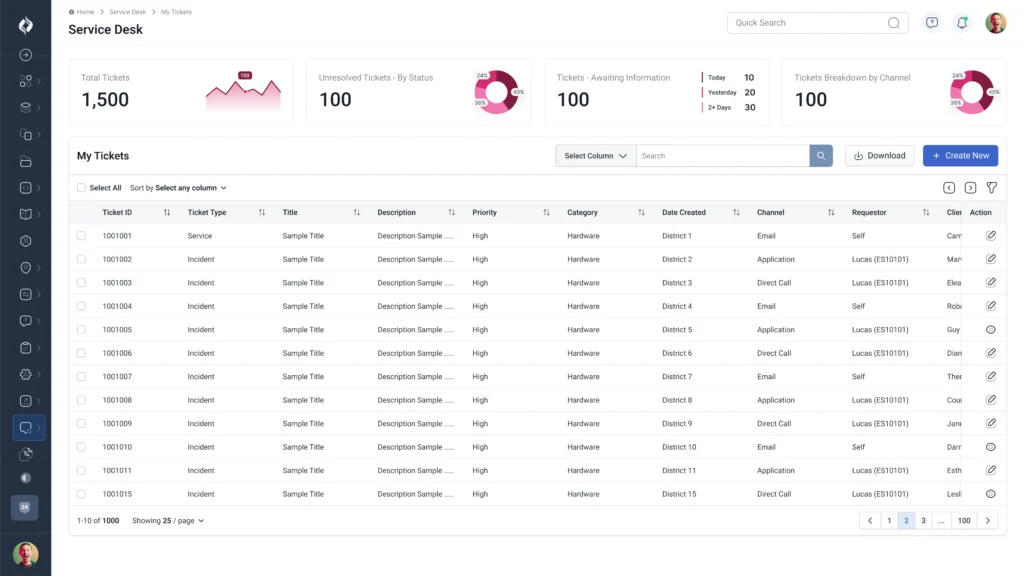
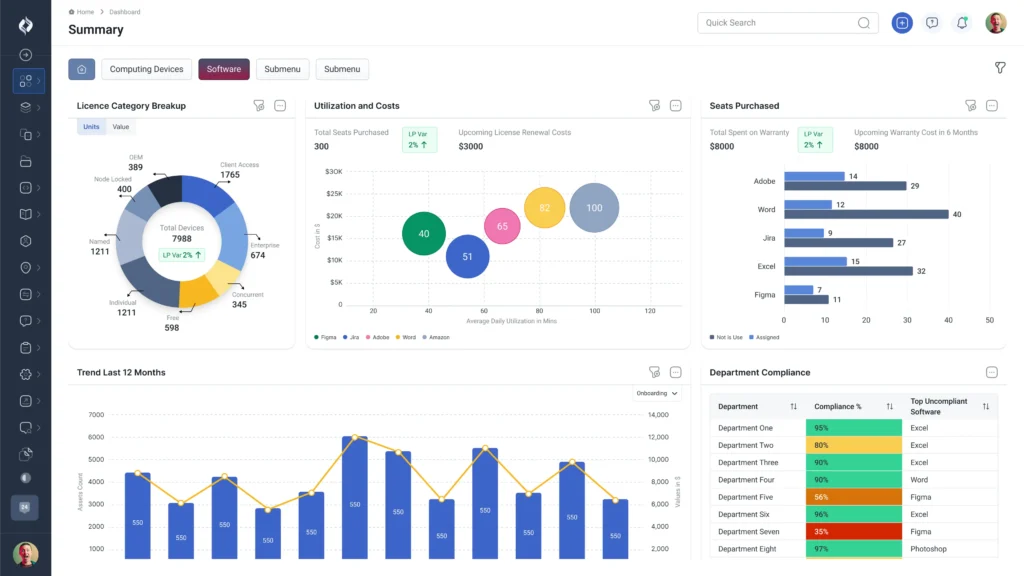
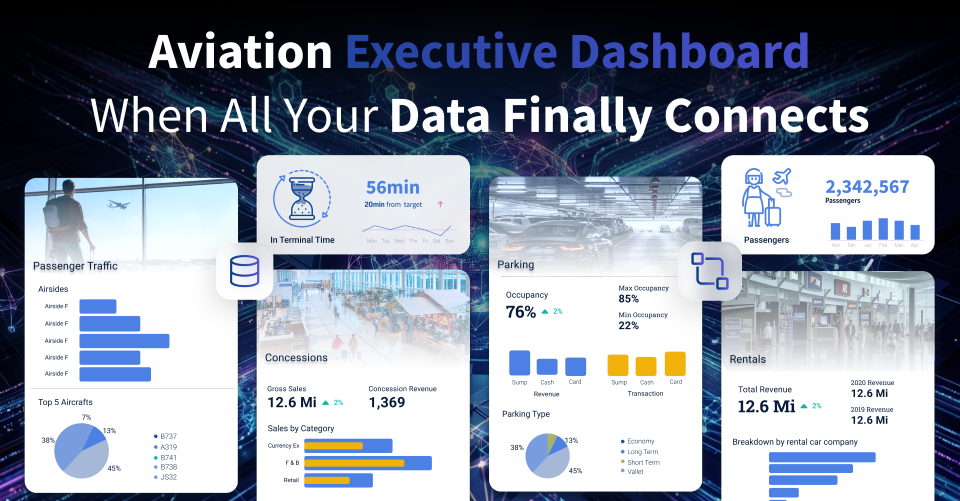
Combine SIS enrollment counts, CRM inquiries, staffing capacity, program costs, and building usage into one unified platform.

Why Districts Choose Hexalytics

Years of Partnership
15 +

K–12 Partnership

We bring deep experience working with school districts and state agencies, helping turn complex education data into clear, strategic insights.

Solutions That Fit Your District

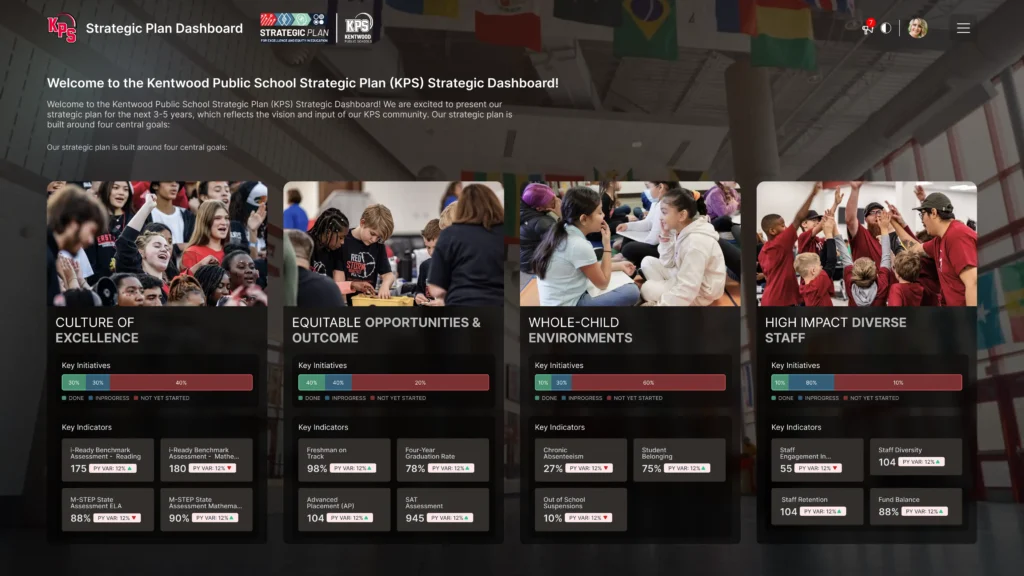
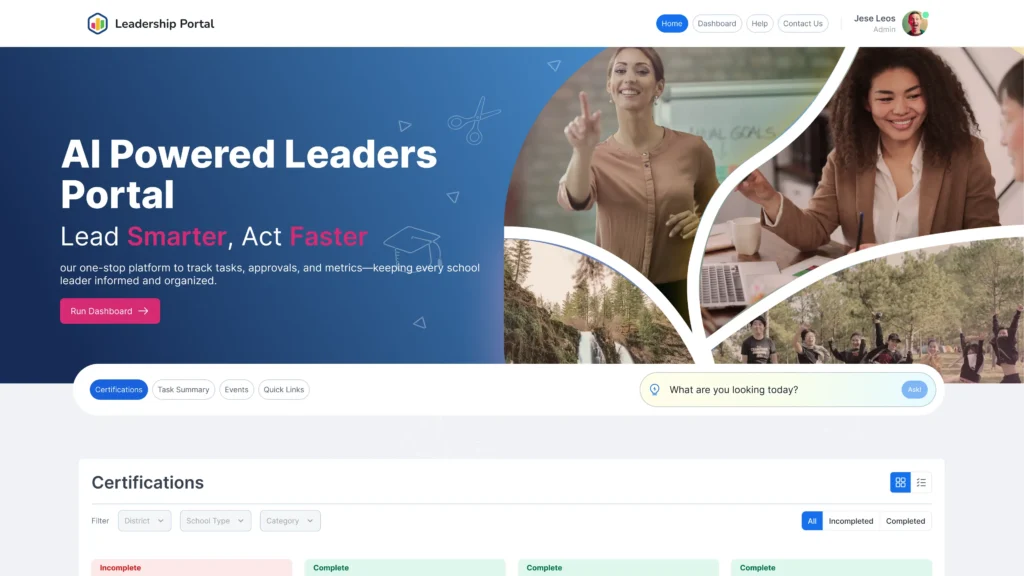
Every dashboard we build is tailored to your goals, your systems, and your leadership style—no rigid templates, just what works for your team.

Clear, Story-Based Dashboards

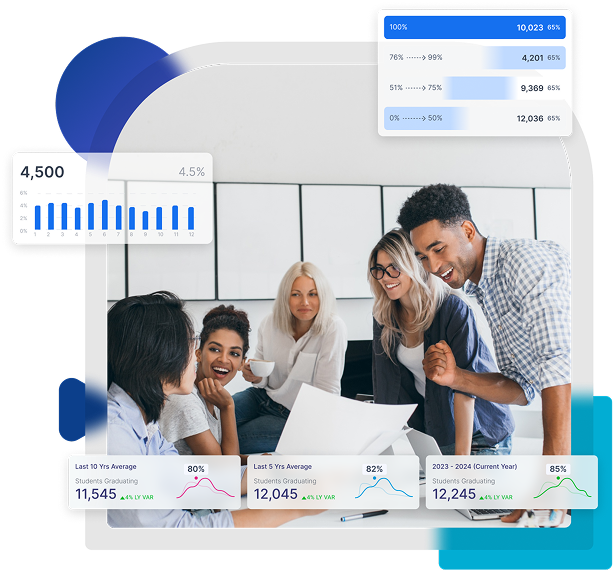
We design dashboards that guide users through your data like a story—making it easy for superintendents, principals, and board members to understand and act.

Seamless Integration with Your Systems

Hexalytics connects to your existing SIS, LMS, finance, HR, and assessment tools—bringing all your critical data together in one place.

Explore Other K-12 Solutions

A unified platform built for district leadership, operational excellence, and data-driven improvement.

Insights & Updates

Explore how AI-powered K-12 data analytics help districts improve enrollment forecasting, protect budgets, and make confident staffing and planning decisions with real-time, decision-ready data.

Frequently Asked Questions

You have questions? We have answers

Because SIS reports freeze a moment in time. Districts need continuous enrollment analytics that track mobility, withdrawals, mid-year entries, and program shifts in real time—not once per term. Hexalytics eliminates the lag so leaders stop planning with stale data.

Traditional projections can’t keep up with real student movement. Hexalytics highlights daily shifts, neighborhood patterns, and grade-level changes, giving HR and principals early signals so staffing becomes proactive, not reactive.

Because demand signals live in many places—CRM, magnet applications, community engagement, survey data. Our platform unifies those signals to show true program demand, yield, and school choice patterns in one view.

Most districts look at capacity and enrollment separately. Hexalytics connects capacity, boundaries, enrollment flows, and feeder patterns, helping leaders adjust space planning before it becomes a crisis.

Forecasting fails when it relies on historical counts alone. Hexalytics uses AI and multi-year patterns—mobility, subgroup trends, local demographics, choice patterns—to deliver predictions that reflect reality, not assumptions.

Manual reports hide early warning signs. The dashboard surfaces transfer hotspots, declining cohorts, high-withdrawal programs, and grade-level drop-offs so leaders can intervene before numbers slide.

Because enrollment touches everyone—HR, finance, academics, operations—but data sits in silos. Hexalytics creates one unified enrollment source of truth, reducing confusion and aligning district-wide decisions.

See the Enrollment Dashboard for Your District

Turn your district plan into real-time progress, alignment, and clear leadership insight. 

Your demo will show:

Turn enrollment patterns, mobility trends, and program demand into real-time district intelligence.

Request a Demo: See Impact in Action

Experience how our intelligent analytics platforms deliver clarity, alignment, and speed to your strategic decisions.