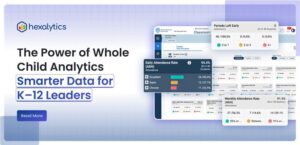
The Power of Whole Child Analytics Smarter Data for K–12 Leaders


Every district leader knows the challenge: data lives in silos. Attendance data sits in one system, SEL surveys in another, and health, behavior, and academic results rarely connect. By the time problems surface, it’s often too late to intervene effectively.
Next, let’s explore how districts are leveraging these dashboards to tackle their toughest challenges.
That’s the pain point Whole Child Dashboards are designed to solve. By integrating diverse data streams into one intelligent platform, districts finally gain a complete, real-time view of student well-being and can lead with confidence.
Next, let’s explore how districts are leveraging these dashboards to tackle their toughest challenges.
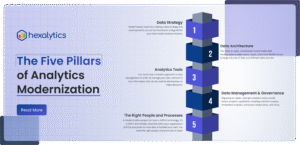
Step 1: Cracking the Toughest Challenges With Whole Child Analytics
Whole Child Dashboards aren’t just reports they’re problem-solvers. Here’s how districts are using them to tackle their biggest challenges:
Traditional reports show who missed class last month. But what leaders really need is foresight who might be at risk tomorrow?
Predictive analytics within Whole Child Dashboards flag early warning signs before absenteeism becomes chronic. With timely insights, districts can adjust transportation, make personal connections, or provide digital learning options.
Result: Fewer missed days and stronger paths to success.
(for identifying patterns of student attendance and flagging chronic absentees)
Referrals and incident reports often tell only part of the story. Counselors may sense a concern but lack the full context.
Whole Child Dashboards connect SEL surveys, behavioral records, and counseling data into one view, so leaders see the bigger picture. The result is faster identification of hotspots, smarter allocation of resources, and healthier classrooms built on trust.
Result: Proactive support instead of reactive fixes.
(Provides visibility into behavioral challenges and SEL trends, connecting them with academic performance.)
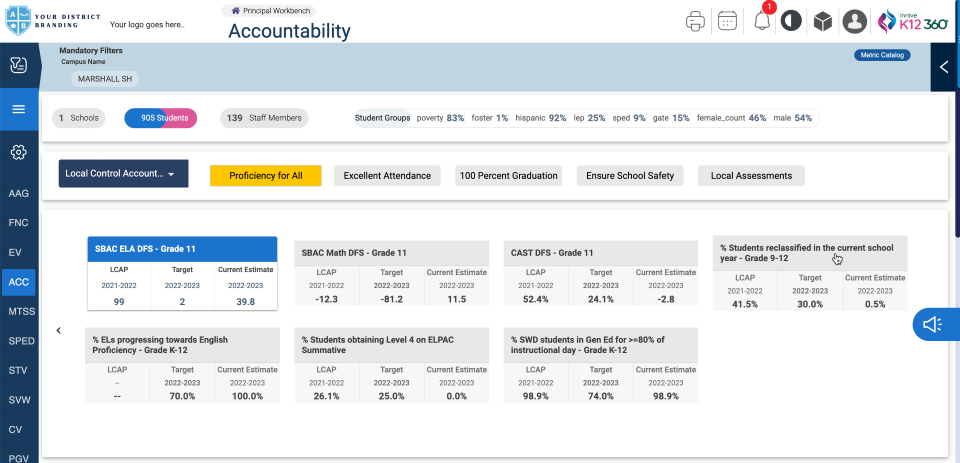
Step 2: Measuring Progress, You Can Trust
Whole Child Dashboards do more than display data, they reshape how districts lead.
They move leaders from reactive fixes to strategic prevention, from fragmented reports to connected insights, and from unclear outcomes to measurable progress.
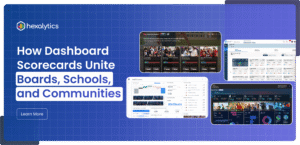
This evolution builds confidence across the system. Boards, educators, and communities can see that leadership isn’t just identifying problems, it’s solving them in real time. When everyone sees progress the same way, trust follows naturally.
Step 3: The Road Ahead With Whole Child Analytics
As the 2025–26 school year brings new challenges teacher shortages, shifting demographics, and funding cliffs districts that embrace Whole Child Analytics will lead with clarity.
These dashboards help leaders spot issues earlier, align resources smarter, and show measurable impact to boards and communities. They don’t just illuminate what’s happening they help districts act before challenges become crises.
In a landscape where every decision matters, Whole Child Analytics turns visibility into leadership.
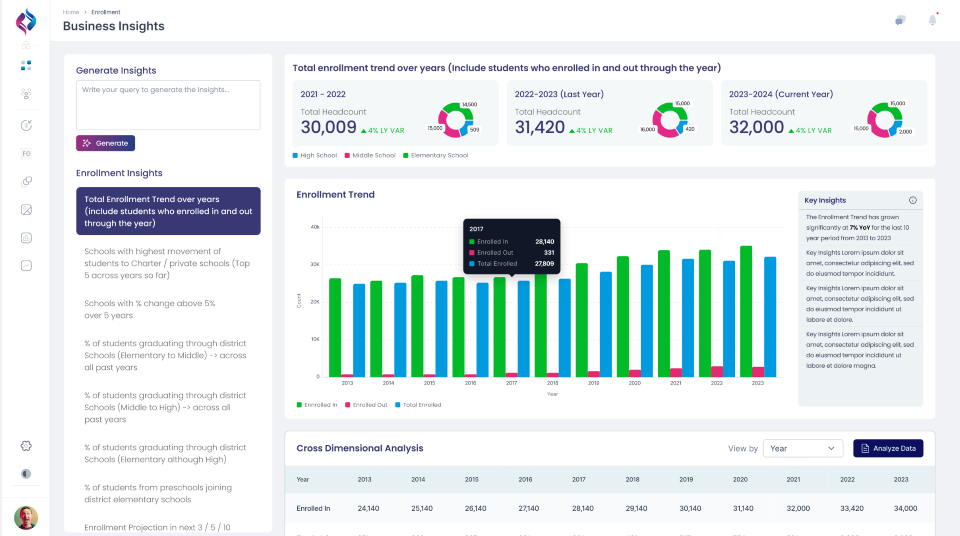
(Helps leaders spot risks in enrollment shifts, at-risk student movement, and funding impacts before they become crises.)
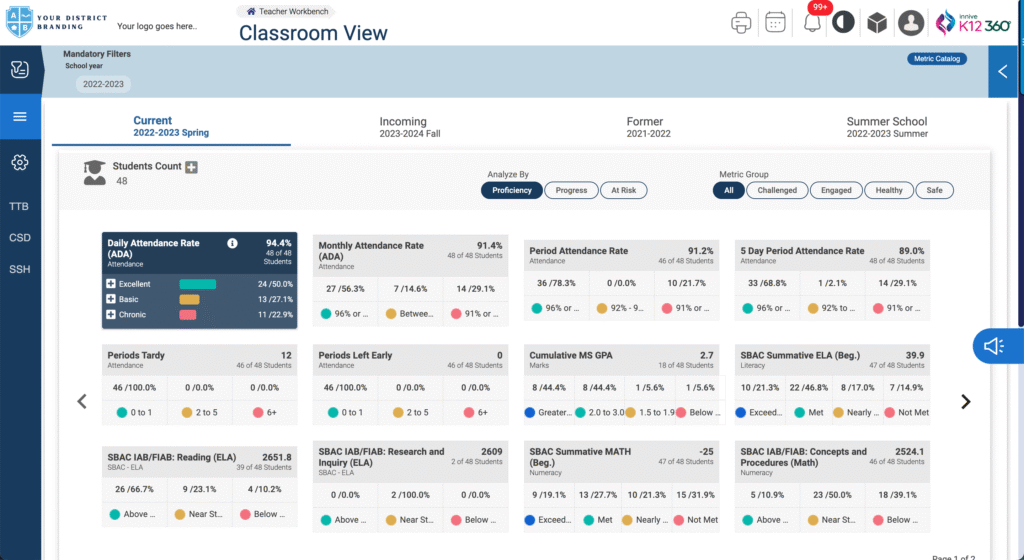
Step 4: Turning Data Into Classroom Action
The power of Whole Child Analytics truly comes alive when insights reach the classroom. Modern dashboards give teachers a single, connected view of attendance, academic performance, behavior, and SEL data removing the need to jump between systems or wait for reports.
Visual indicators highlight what matters most students who may need attention, those showing early signs of concern, and those performing well. With dynamic views and regular updates, teachers can easily move from classroom overviews to individual profiles with just a few clicks.
To make these insights meaningful, districts are investing in data literacy training so teachers feel confident interpreting patterns, identifying early warning signs, and measuring the impact of their strategies. Mentorship and peer learning build a lasting culture of collaboration and informed decision-making.
Team-based data reviews extend this collaboration further. Grade-level and subject-area teams analyze patterns, share successful practices, and coordinate supports. When counselors and support staff join these conversations, data becomes a shared language for understanding the whole child.
Finally, automation helps teachers save time by generating routine updates, alerts, and summaries automatically translating numbers into clear, actionable insights for educators, leaders, and families alike.
The Future of Data-Driven Support
Whole Child Analytics is transforming how schools connect data, people, and purpose. It bridges the gap between strategic vision and classroom reality helping districts turn every data point into a pathway for growth.
The result? Smarter insights, stronger systems, and more confident leadership at every level.
Want to see how Whole Child Dashboards can help your district turn challenges into measurable success?
Learn more at Hexalytics.com
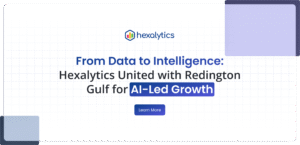
Hexalytics: Turning Data into Decisions That Drive Growth
Hexalytics delivers AI and analytics solutions that help organizations move from data to decisions with clarity. Our flexible solutions, from strategic dashboards to intelligent automation, equip leaders to uncover insights, align priorities, and create measurable impact.
Hexalytics builds solutions that start simple and grow with your vision. With deep expertise in AI, GenAI, and data visualization, we help organizations streamline processes, uncover opportunities, and achieve lasting success.
At Hexalytics, we believe data should work for you so you can focus on leading, innovating, and growing.

Leading with Clarity in the Age of Complexity Across the U.S., K-12 school administrators are navigating an era of expanding responsibility but diminishing clarity. From certification approvals and compliance reporting to instructional oversight and staff coordination, superintendents and principals are increasingly challenged by fragmented education data systems and disconnected workflows. A 2024 RAND Corporation study…
Across U.S. school districts, enrollment data is shaping some of the most important decisions for 2025 and beyond — from staffing and budgeting to equity and long-term planning. Yet in many districts, this data remains scattered across spreadsheets and disconnected systems, making it hard to see the full picture. This blog explores how Enrollment Analytics…
Most dashboards stop at reporting.They tell you what happened—but not what to do next. In a market where speed and precision matter more than ever, that’s not enough.Businesses today need systems that do more than display data. They need intelligence—built in.At Hexalytics, we help organizations transform the way they use data. Our AI-powered dashboards don’t…
In every school district, there are important questions being asked every day: Are our students learning what they need to thrive? Are we supporting every child, in every school? Are our efforts actually making a difference? The truth is—everyone’s trying their best. But it’s hard to stay on the same page when different people are…
District and enterprise leaders are entering 2025 under pressure. From rising expectations for transparency to the demand for faster, smarter decisions, the old way of managing reports and static spreadsheets is no longer enough. Leaders need clarity, alignment, and confidence in every decision without losing time in the noise of fragmented systems. According to the…

Digital learning has never been more dependent on reliable technology. According to CoSN’s annual EdTech Leadership Survey and Gartner’s ITSM Market Insights, districts now manage more devices, apps, and cloud systems than ever yet many still face slow support, rising downtime, and disconnected service workflows across their IT service management for school districts. Modern IT…