How Enrollment Analytics Are Powering Smarter District Planning


Across U.S. school districts, enrollment data is shaping some of the most important decisions for 2025 and beyond — from staffing and budgeting to equity and long-term planning. Yet in many districts, this data remains scattered across spreadsheets and disconnected systems, making it hard to see the full picture.
This blog explores how Enrollment Analytics transforms district planning. It looks at how the AI-powered Enrollment Dashboard helps leaders unify student data, forecast future trends, and plan with precision. By connecting enrollment, demographics, and spending data in one clear view, it turns complexity into clarity — helping every decision start with insight.
Real-Time Enrollment Tracking
Every enrollment event of arrival, transfer, and withdrawal tells part of your district’s story. The Enrollment Dashboard connects these threads, helping leaders visualize how shifts in enrollment affect outcomes, programs, and equity goals.
With real-time tracking, leaders can see trends as they happen. Whether it’s an unexpected surge of new students, changing demographics, or emerging gaps, the dashboard provides clarity before challenges escalate.

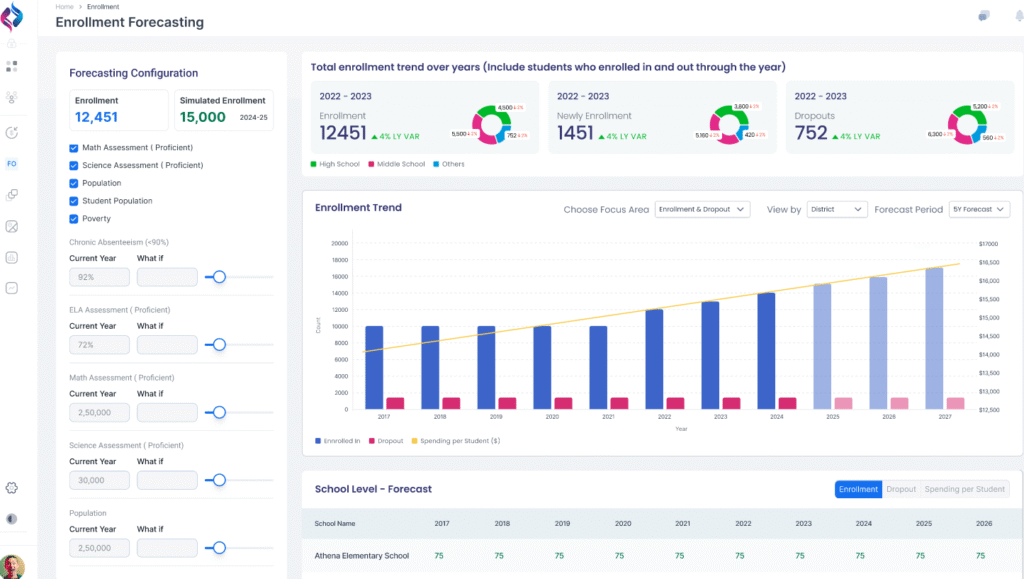
Predictive Intelligence with AI
Powered by AI and machine learning, the dashboard moves beyond static reporting. It helps districts:
This blend of predictive analytics and practical insight gives leaders the clarity to plan ahead not just respond.
Data That Drives Equity
Every community deserves fair access to opportunity. The Enrollment Dashboard empowers districts to plan through an equity-first lens, surfacing demographic and geographic insights that show where support is needed most.
From identifying low-conversion ZIP codes to tracking enrollment by ethnicity, gender, or special populations, leaders can ensure that programs and investments reach every learner without leaving anyone unseen.
Building Clarity Across Leadership
When enrollment data is unified, decisions become clearer, faster, and more strategic. Districts gain:
Leading with Insight
In a time of rapid change, leaders need tools that don’t just report; they need systems that anticipate, connect, and guide. The Enrollment Dashboard transforms data into a shared foundation for action and continuous improvement. Because when every insight connects, every decision moves the district forward.
Hexalytics: Turning Data into Decisions That Drive Growth
Hexalytics delivers AI and analytics solutions that help organizations move from data to decisions with clarity. Our flexible solutions — from strategic dashboards to intelligent automation — empower leaders to uncover insights, align priorities, and create a measurable impact.
We build solutions that start simple and grow with your vision. With deep expertise in AI, GenAI, and data visualization, Hexalytics helps organizations streamline processes, uncover opportunities, and achieve lasting success.
At Hexalytics, we believe data should work for you — so you can focus on leading, innovating, and growing.
Discover how Hexalytics can help your organization turn insight into impact. Get in touch | Explore Solutions

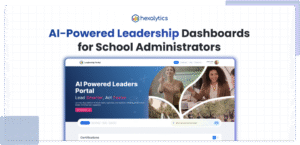
Leading with Clarity in the Age of Complexity Across the U.S., K-12 school administrators are navigating an era of expanding responsibility but diminishing clarity. From certification approvals and compliance reporting to instructional oversight and staff coordination, superintendents and principals are increasingly challenged by fragmented education data systems and disconnected workflows. A 2024 RAND Corporation study…

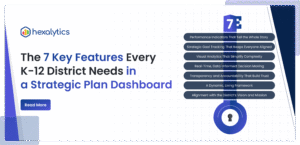
This blog explores the essential features every district should consider when implementing a Strategic Plan Dashboard. Learn how connected KPIs, real-time data access, customization, usability, and data security work together to transform strategic plans from static documents into living systems of progress and accountability. Here are the essential features that make the Strategic Plan Dashboard…

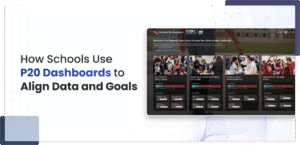
Across the U.S., education leaders are rethinking how data connects learning from preschool through postsecondary education. The P-20 model, which spans early learning, K-12, higher education, and workforce readiness, aims to make every learner’s journey coherent, measurable, and supported by shared insight. Yet most education systems still operate in silos, limiting visibility into how early…
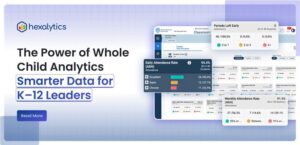
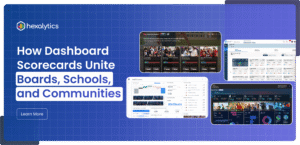
In every school district, there are important questions being asked every day: Are our students learning what they need to thrive? Are we supporting every child, in every school? Are our efforts actually making a difference? The truth is—everyone’s trying their best. But it’s hard to stay on the same page when different people are…

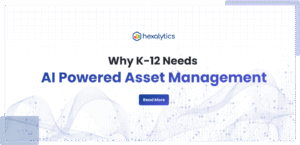
Across today’s schools and districts, technology has become the backbone of learning. From laptops to lab equipment, leaders are managing thousands of assets across multiple campuses, often with limited visibility or outdated systems. Spreadsheets and manual records can’t keep pace with the growing complexity of digital ecosystems. Without a unified approach to K-12 asset management…
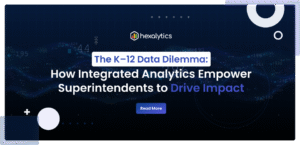
Every district leader knows the challenge: data lives in silos. Attendance data sits in one system, SEL surveys in another, and health, behavior, and academic results rarely connect. By the time problems surface, it’s often too late to intervene effectively. Next, let’s explore how districts are leveraging these dashboards to tackle their toughest challenges. That’s…