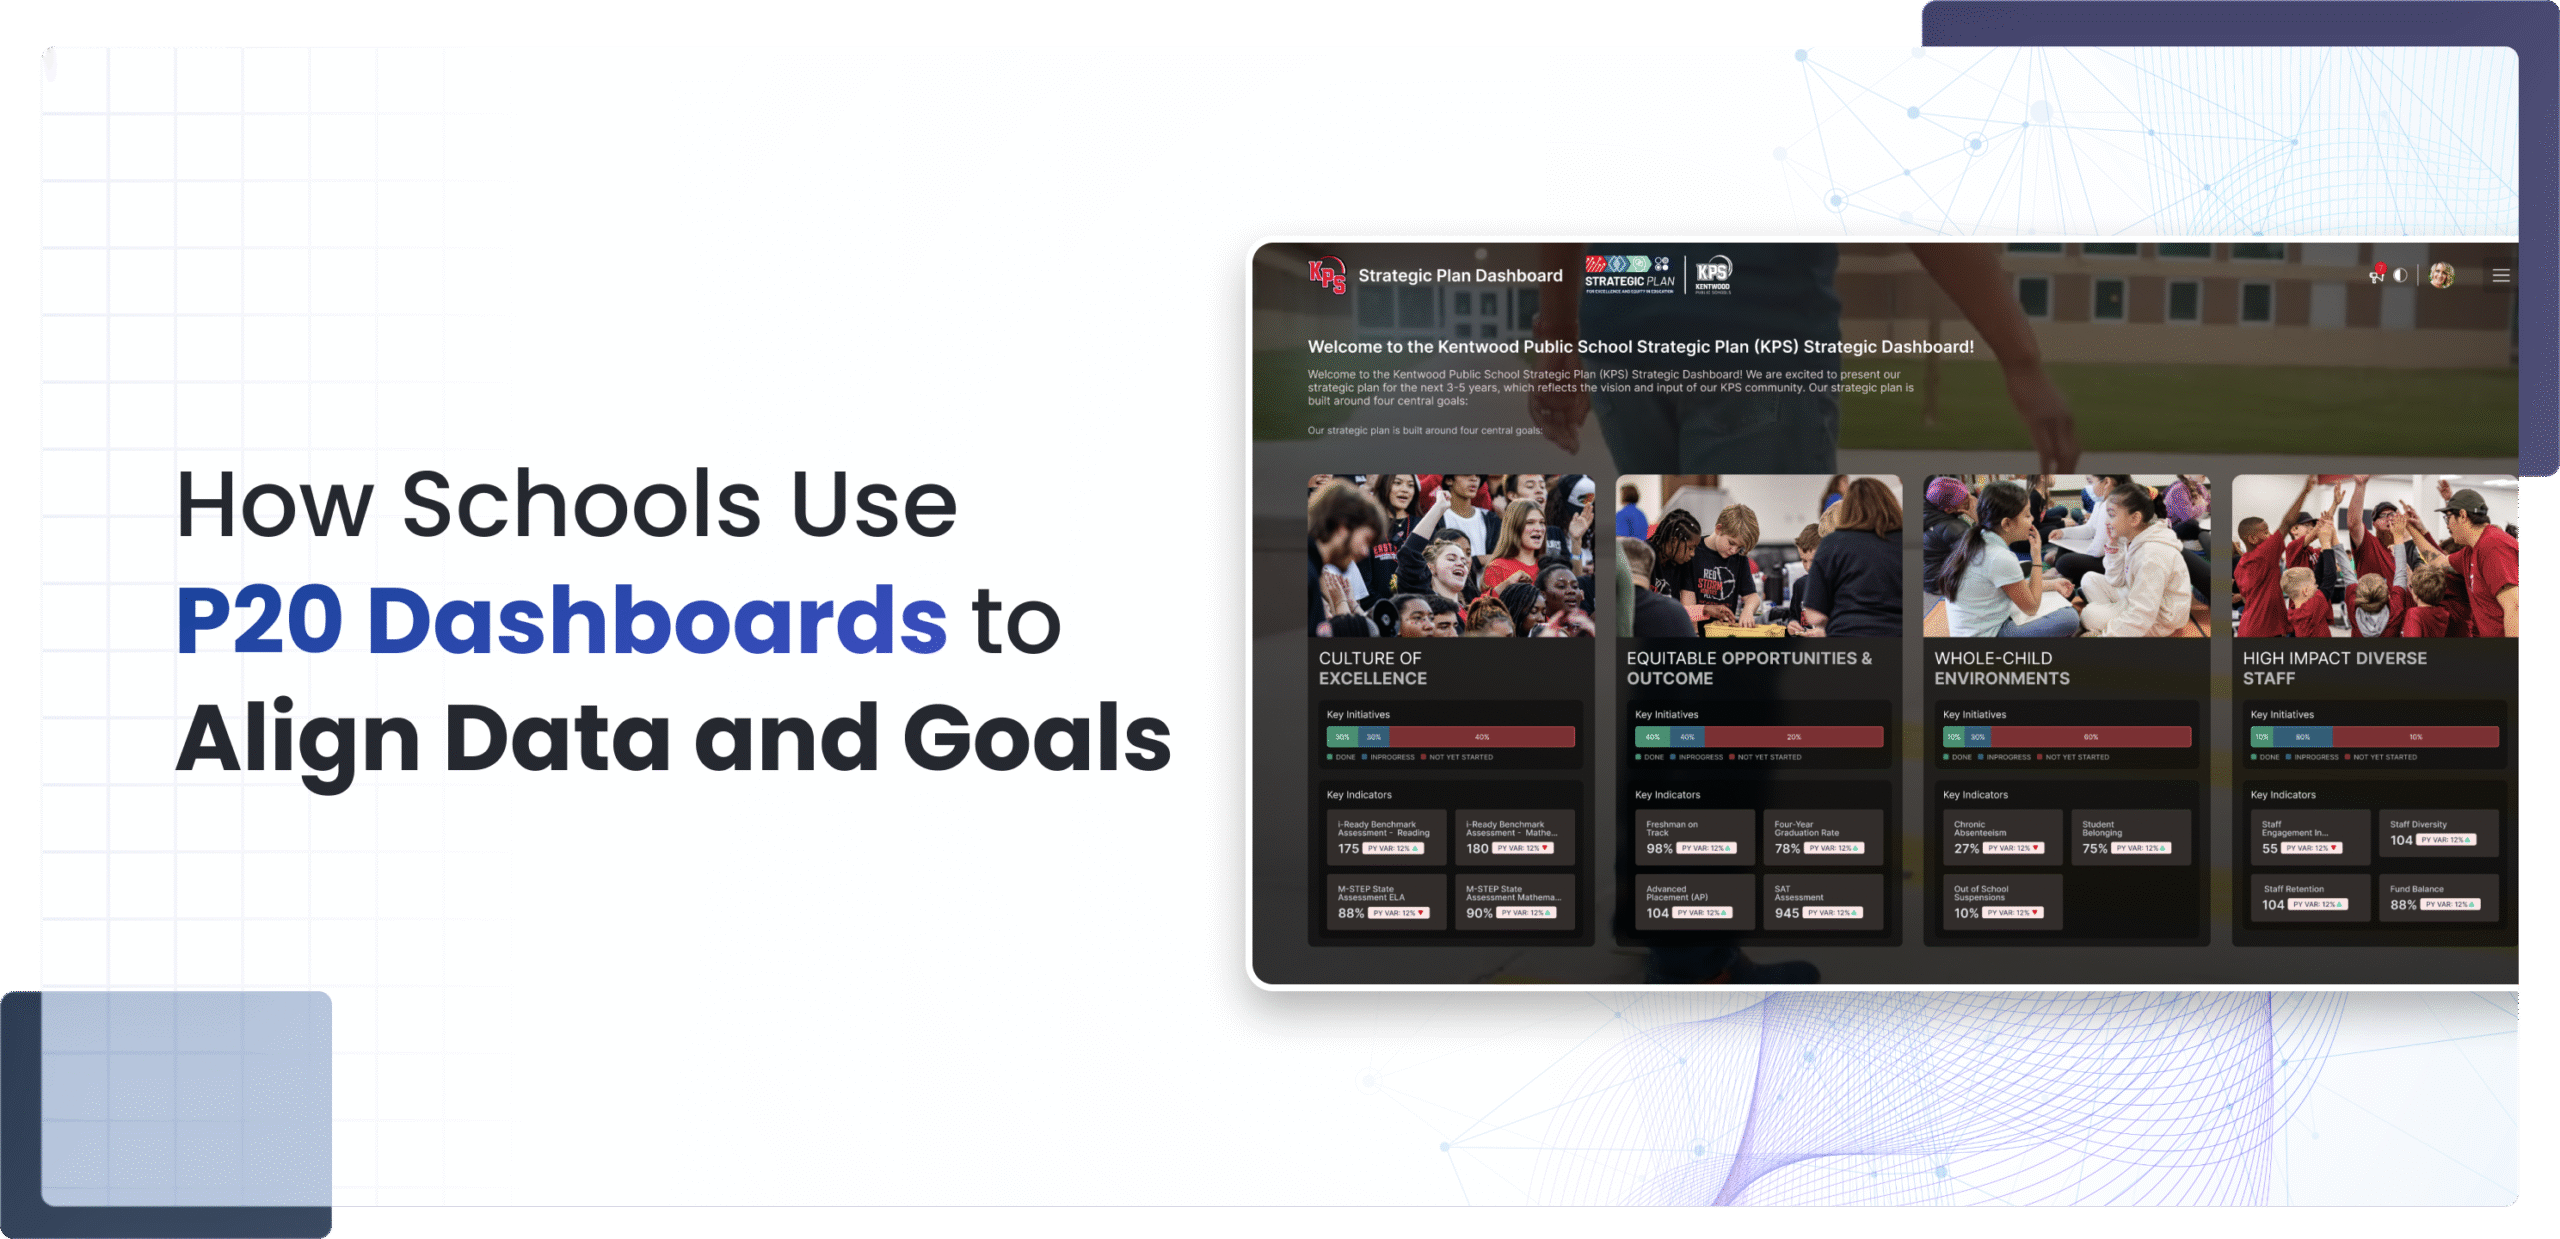
How Schools Use P20 Dashboards to Align Data and Goals

Across the U.S., education leaders are rethinking how data connects learning from preschool through postsecondary education. The P-20 model, which spans early learning, K-12, higher education, and workforce readiness, aims to make every learner’s journey coherent, measurable, and supported by shared insight.

Yet most education systems still operate in silos, limiting visibility into how early learning connects to long-term outcomes. That is where AI-powered P-20 dashboards are transforming the landscape.

According to national research from Education Week and the U.S. Department of Education’s SLDS Grant Program, over 40 states are investing in P‑20W (Preschool to Workforce) data systems to connect student outcomes, educator development, and career pathways.
This blog explores how solutions like the Hexalytics P‑20 Strategic Plan Dashboard unify student, financial, and operational data providing real-time insights, goal alignment, and transparency from preschool to postsecondary.
1. Bringing Structure to Educational Strategy
Digital transformation in enterprise depends on structured frameworks; education is no different. A strategic plan dashboard for P‑20 districts provides structure by integrating SIS, assessments, attendance, and postsecondary outcomes into one cohesive foundation.
This unified view ensures all stakeholders work from the same source of truth, allowing district and state leaders to align priorities, measure performance, and communicate progress with confidence. Without it, strategic plans risk remaining static documents rather than living tools for continuous improvement.
2. Aligning Goals and KPIs Across the P20 Pipeline

From early literacy to career readiness, every initiative should connect to measurable outcomes. P20 school district dashboards make this possible by visualizing key performance indicators tied to each strategic goal.

Leaders can see how attendance initiatives influence graduation rates or how academic interventions affect college enrollment. This goal aligned storyboarding ensures that every classroom action and resource decision contributes directly to the district’s broader mission.
3. Accelerating Insight Through Real Time Monitoring
Traditional reporting cycles often leave leaders reacting to outdated data. With real time visibility, districts can move from reactive management to proactive leadership.
Dashboards that track academic and social emotional indicators help identify trends early and support immediate action. If engagement dips or attendance declines, leaders can respond in the moment, not months later.
This continuous feedback loop empowers schools to evaluate impact, adjust strategies swiftly, and sustain progress toward key goals.
4. Promoting Equity Through Deep Data Visibility
Dashboards that allow data disaggregation by income, language, race, or disability help uncover disparities in performance and access.
Rather than relying on averages, leaders can pinpoint which student groups need additional support, where resources must be reallocated, and how interventions are performed over time.
By turning equity into measurable insight, districts move from intention to action, creating inclusive strategies that ensure every learner is seen, supported, and valued.
5. Strengthening Collaboration and Shared Accountability
When principals, teachers, and cabinet members all view the same insights, collaboration naturally deepens. Dashboards replace assumption-based meetings with focused, evidence-driven conversations. Reviews evolve from “what happened” to “what should we do next.”
With everyone aligned on goals and metrics, trust and accountability strengthen at every level, from classroom to boardroom.
6. Extending Value Beyond Academic Metrics
P20 strategic plan dashboards go far beyond academic performance. Their integrated perspective supports workforce development, funding alignment, and community partnerships.
By connecting longitudinal data, from K12 through postsecondary, districts and states can identify programs that work, replicate best practices, and ensure investments lead to measurable outcomes.
The same intelligence that guides instruction also informs policy, budgeting, and strategic collaboration across sectors.
Conclusion
P20 dashboards give districts and states a clearer, connected view of student success from early learning through postsecondary outcomes. By bringing strategy, data, and monitoring into one aligned system, leaders can make faster decisions, strengthen equity, and track progress with confidence.
About Hexalytics
Hexalytics is a leading provider of AI-powered data intelligence platforms purpose-built for the education sector. From K–12 to P–20 and beyond, our solutions empower school districts, state agencies, and education leaders with real-time dashboards, strategic planning tools, and unified insights that drive measurable impact. With over 15 years of experience in education technology, we transform complex data into actionable intelligence, fueling better decisions, transparency, and equity across the learner journey.
Frequently Asked Questions
How does a P20 dashboard make reporting easier?
A P20 dashboard brings all key data into one place. Leaders no longer need to pull reports from different systems, which saves time and reduces errors.
Yes. A P20 dashboard can be customized to match your goals, KPIs, and reporting needs so it reflects exactly what your team wants to track.
Everyone sees the same real-time information. This keeps meetings focused, aligns decisions, and helps teams stay on the same page.
It allows leaders to break down data by student group, school, or program. This makes it easier to spot gaps and understand where extra support is needed.
When early learning, K12, and postsecondary data are linked, leaders can see how early patterns shape long-term outcomes. This helps improve programs, guide resources, and strengthen results across the full learner journey.

Key Takeaways:

  • P-20 dashboards unify data from early learning through postsecondary.

  • They turn strategic plans into measurable, real-time systems.

  • Aligned goals and KPIs strengthen student and district outcomes.

  • Equity improves when leaders can see and act on gaps clearly.

  • Hexalytics helps districts make faster, smarter, and connected decisions.

Similar articles

Leave a Reply

Your email address will not be published. Required fields are marked *