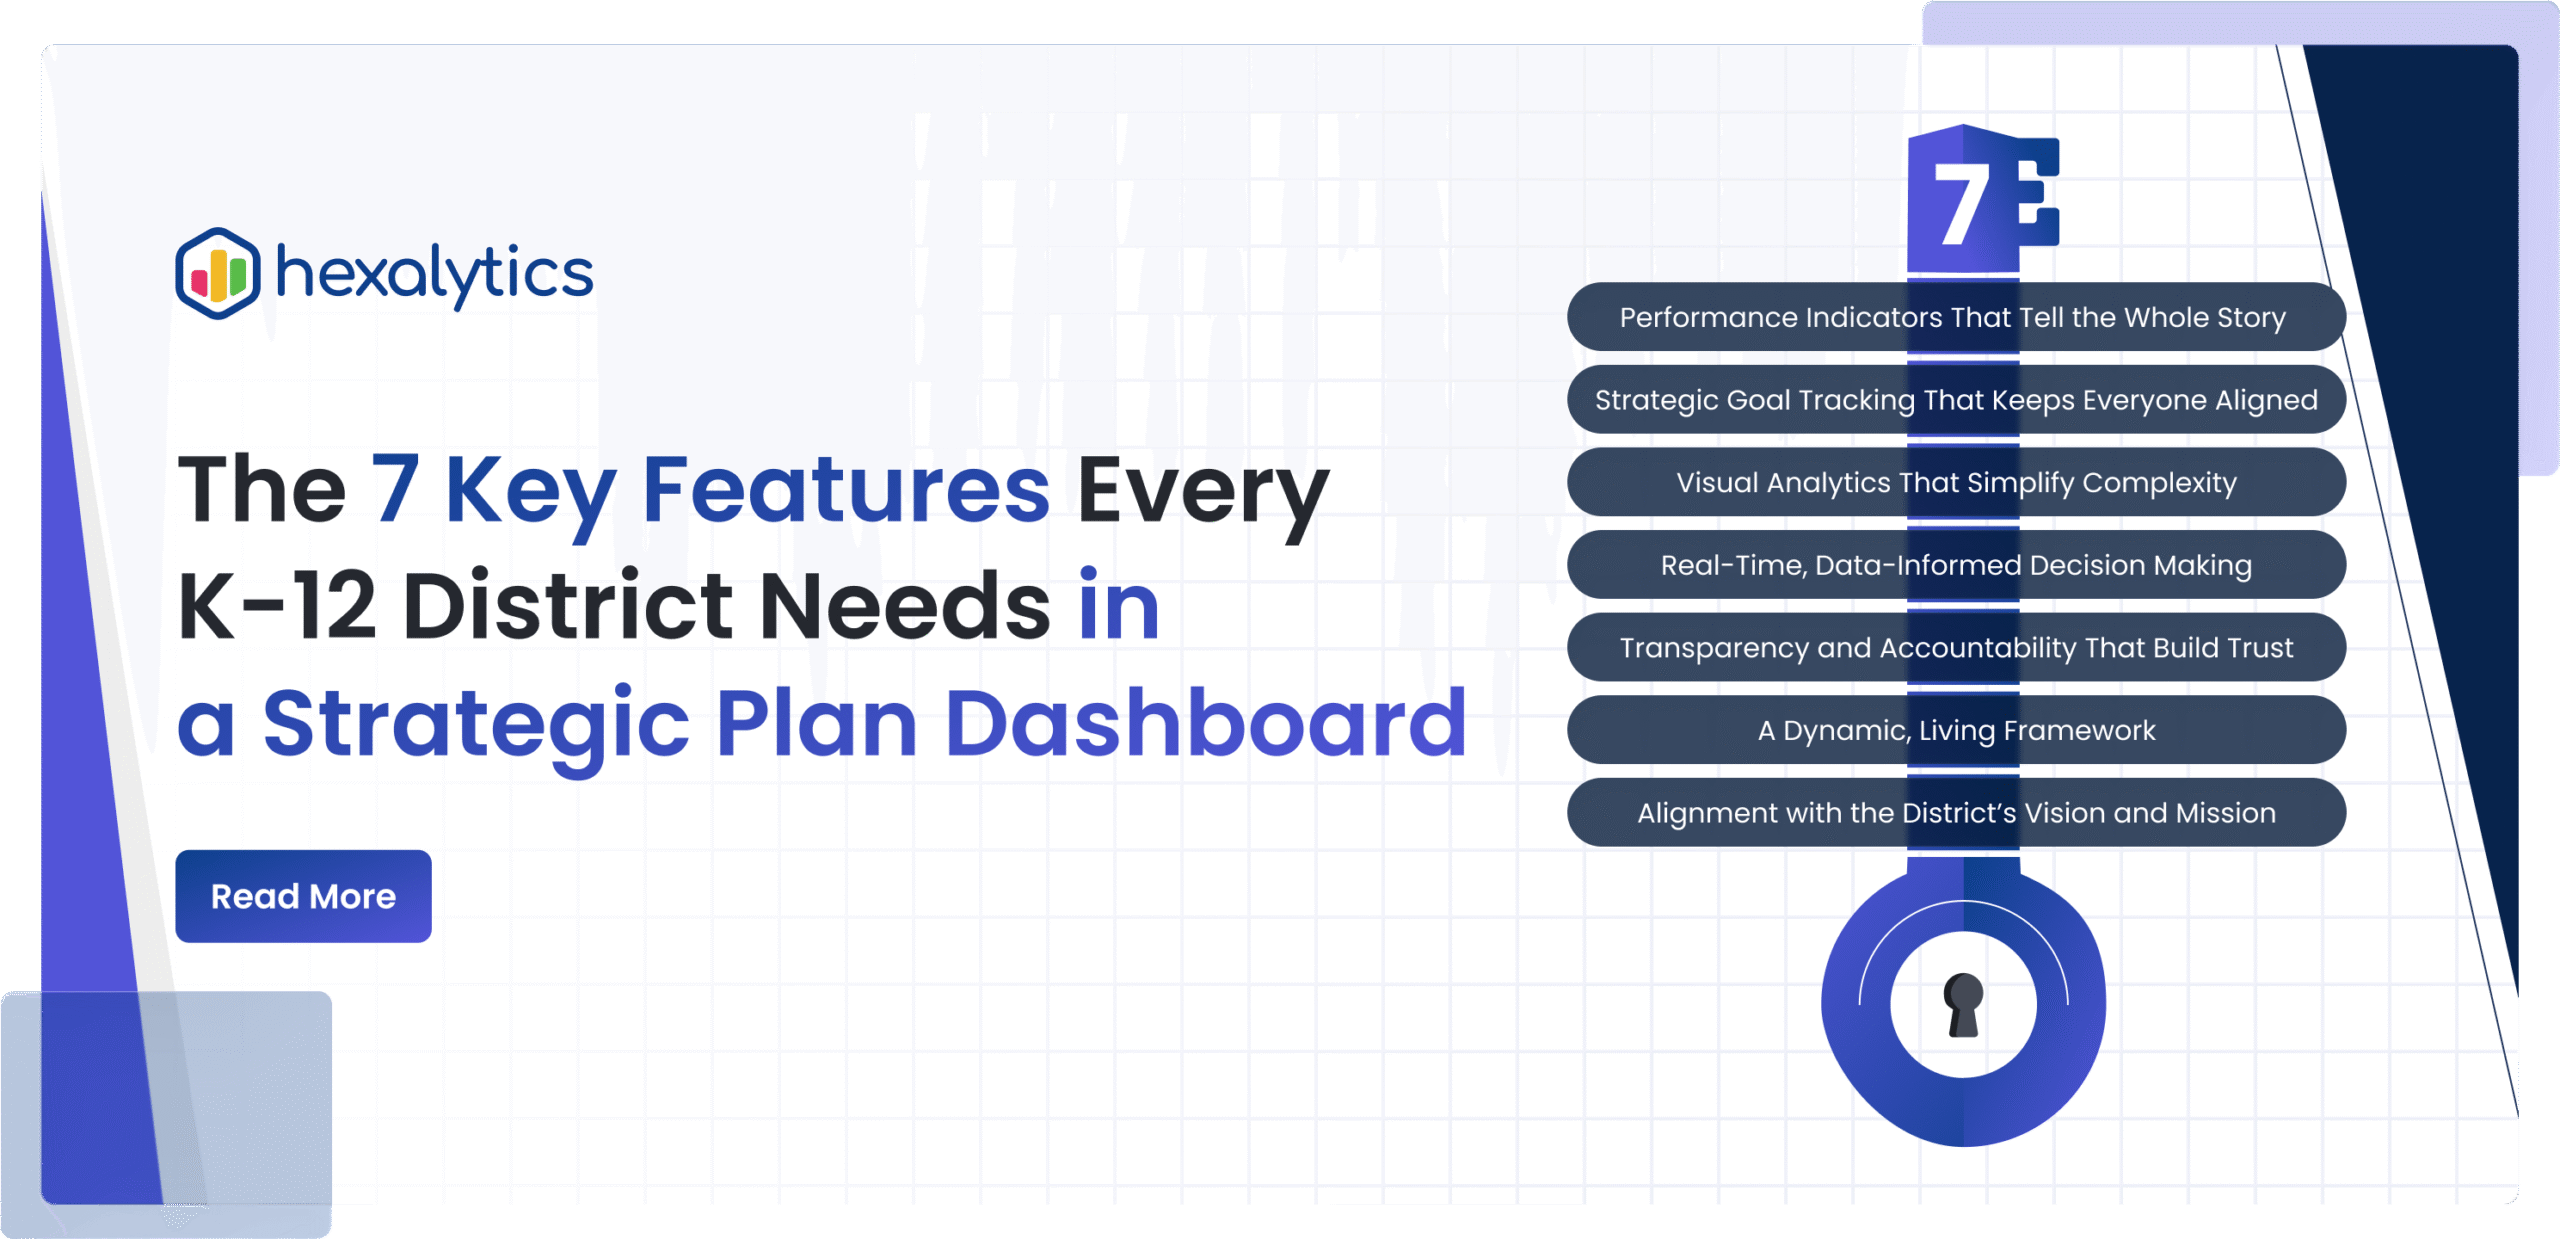
The 7 Key Features Every K-12 District Needs in a Strategic Plan Dashboard


This blog explores the essential features every district should consider when implementing a Strategic Plan Dashboard. Learn how connected KPIs, real-time data access, customization, usability, and data security work together to transform strategic plans from static documents into living systems of progress and accountability.
Here are the essential features that make the Strategic Plan Dashboard an indispensable tool for school district leaders:
A powerful dashboard starts with the right metrics. The Key Performance Indicators (KPIs) span every area of district success from academics to operations.
Leaders can monitor:
These indicators bring every part of the district’s mission into a single, integrated view.
The dashboard turns the district’s strategic goals and objectives into measurable outcomes.
Whether improving literacy, enhancing student wellness, or optimizing operations, leaders can track progress in real time, visualize milestones, and identify areas that need attention.
It makes the strategic plan an integral part of the day-to-day, turning high-level goals into concrete actions that shape daily decisions.
Great design converts data into clarity and understanding.
With interactive charts, trend lines, and benchmarks, the dashboard transforms raw information into visual stories. Leaders can compare performance over time, evaluate initiatives, and communicate results effectively whether in a board meeting or community update.
With real-time data insights, you can make faster, more informed decisions without waiting. Get instant access to actionable analytics anytime, anywhere.
The Strategic Plan Dashboard delivers real-time data that empowers leaders to act immediately.
From budget adjustments to instructional interventions, every decision is backed by current, accurate information fostering a culture of responsiveness and continuous improvement.
Public dashboards strengthen confidence in district leadership.
By sharing clear, visual progress toward goals, districts can demonstrate how resources are used, how strategies are performing, and how outcomes are improving.
This transparency fosters trust with boards, families, and communities showing that every decision is rooted in evidence and shared responsibility.
Unlike static reports, the dashboard evolves with the district.
As priorities shift or new initiatives begin, leaders can update metrics, refine goals, and realign data sources ensuring the dashboard always reflects current realities and future ambitions.
It becomes a living document flexible, responsive, and always relevant.
At its core, the dashboard connects data directly to its purpose.
Every indicator, visualization, and report links back to the district’s mission, vision, and strategic pillars ensuring that every number tells part of a larger story: student success.
With live data, intuitive visualizations, and customizable KPIs, district leaders can easily see what’s working, where gaps exist, and how to adjust strategies before issues grow.
Instead of scattered spreadsheets and static reports, Strategic Plan Dashboard brings together the full story of district performance. It helps superintendents, boards, and data teams move from reporting to understanding and from planning to measurable progress.
With a modern, flexible, and education-focused design, Strategic Plan Dashboard empowers leaders to connect goals to data, align teams around results, and show the community that progress is happening every day.
Discover how Hexalytics helps districts turn strategy into measurable success at Hexalytics.com
Hexalytics delivers AI and analytics solutions that help organizations move from data to decisions with clarity. Our flexible solutions, from strategic dashboards to intelligent automation, equip leaders to uncover insights, align priorities, and create measurable impact.
Hexalytics builds solutions that start simple and grow with your vision. With deep expertise in AI, GenAI, and data visualization, we help organizations streamline processes, uncover opportunities, and achieve lasting success.
At Hexalytics, we believe data should work for you so you can focus on leading, innovating, and growing.

Across the U.S., education leaders are rethinking how data connects learning from preschool through postsecondary education. The P-20 model, which spans early learning, K-12, higher education, and workforce readiness, aims to make every learner’s journey coherent, measurable, and supported by shared insight. Yet most education systems still operate in silos, limiting visibility into how early…
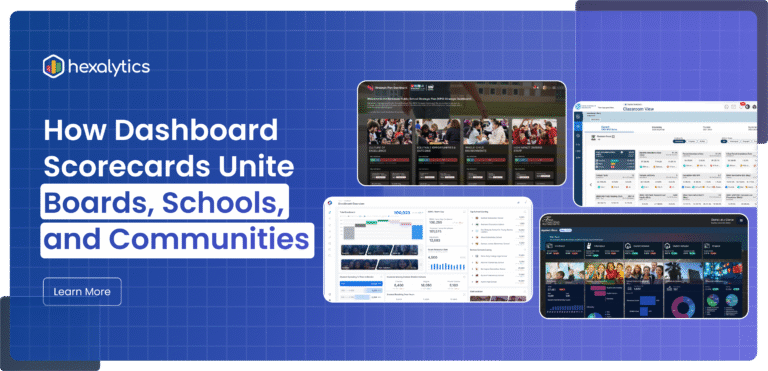
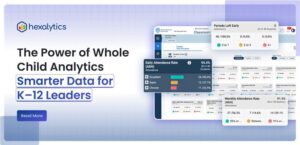
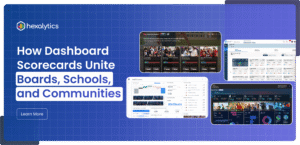
In every school district, there are important questions being asked every day: Are our students learning what they need to thrive? Are we supporting every child, in every school? Are our efforts actually making a difference? The truth is—everyone’s trying their best. But it’s hard to stay on the same page when different people are…
Across U.S. school districts, enrollment data is shaping some of the most important decisions for 2025 and beyond — from staffing and budgeting to equity and long-term planning. Yet in many districts, this data remains scattered across spreadsheets and disconnected systems, making it hard to see the full picture. This blog explores how Enrollment Analytics…
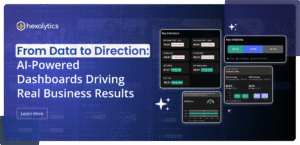
District and enterprise leaders are entering 2025 under pressure. From rising expectations for transparency to the demand for faster, smarter decisions, the old way of managing reports and static spreadsheets is no longer enough. Leaders need clarity, alignment, and confidence in every decision without losing time in the noise of fragmented systems. According to the…

Digital learning has never been more dependent on reliable technology. According to CoSN’s annual EdTech Leadership Survey and Gartner’s ITSM Market Insights, districts now manage more devices, apps, and cloud systems than ever yet many still face slow support, rising downtime, and disconnected service workflows across their IT service management for school districts. Modern IT…
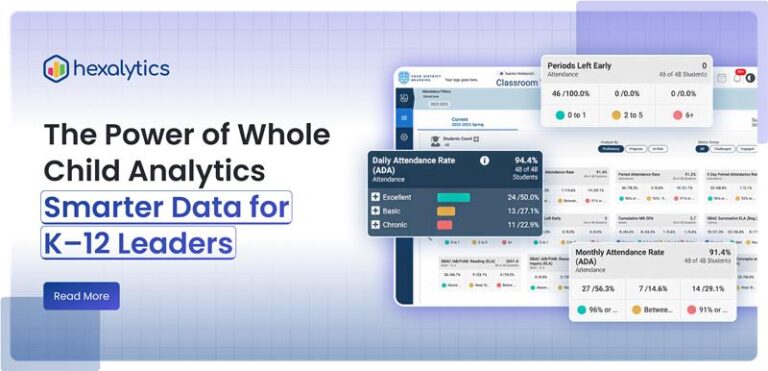
Every district leader knows the challenge: data lives in silos. Attendance data sits in one system, SEL surveys in another, and health, behavior, and academic results rarely connect. By the time problems surface, it’s often too late to intervene effectively. Next, let’s explore how districts are leveraging these dashboards to tackle their toughest challenges. That’s…